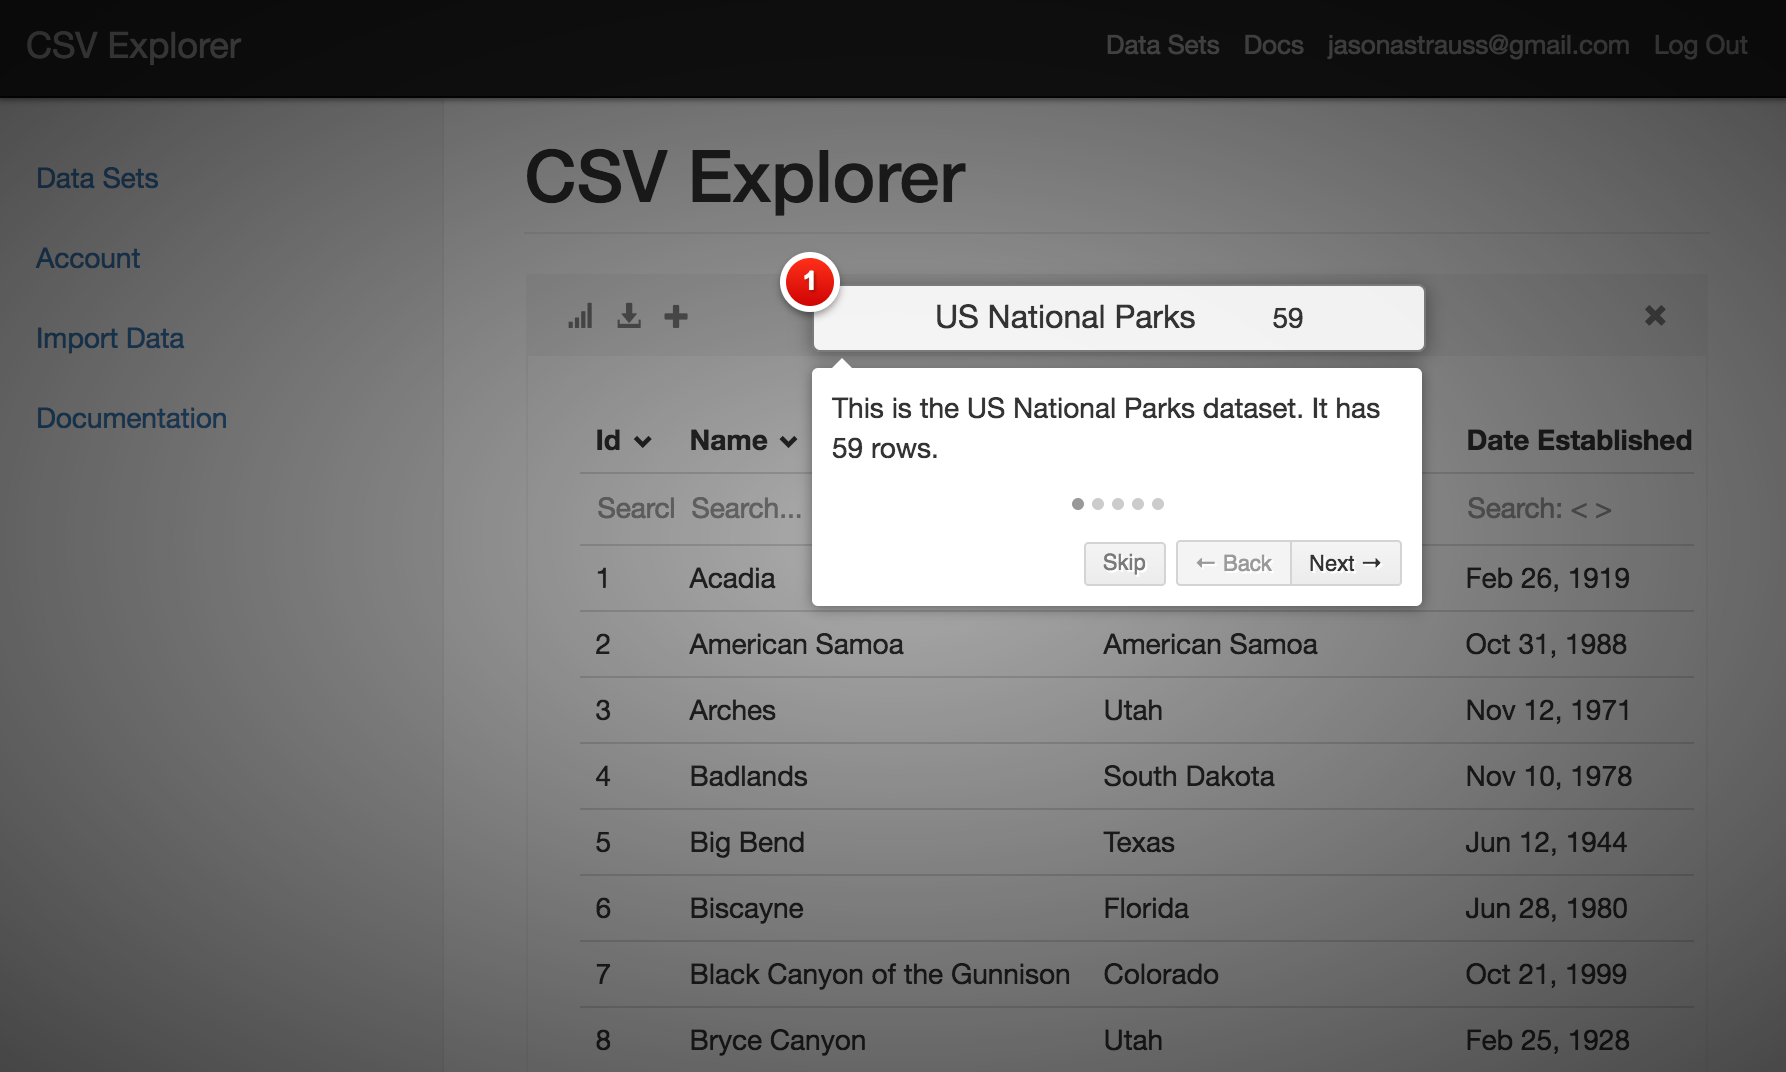
Quick Start
Getting Started
Getting started with CSV Explorer is easy
- Sign Up (and verify your email)
- Upload a CSV file
- Start Exploring
Uploading Files
How to Upload
CSV Explorer accepts CSV files of almost any size and configuration. You can upload from your computer, Box, Google Drive, Amazon Cloud Drive, Github, and URLs.
To upload a new CSV, log in and go to the datasets page. Click "Import Data" or drag and drop a file onto the gray box.
CSV Formats
CSV Explorer will intelligently determine most CSV configurations.
| Header row | A header row is required on all files |
| Delimiter | CSV Explorer will attempt to determine the delimiter. Acceptable delimiters are commas, tabs (\t), and semicolons |
| Line Breaks | CR (\r), LF(\n), or CRLF line breaks are accepted and allowed within quoted fields |
| Quote char | Quote characters are necessary if a delimiter or line break appear in a field |
| Empty Fields | Empty Fields should not be quoted in quote chars |
| File Encoding | CSV Explorer will attempt to determine the encoding, UTF-8 is preferred |
| Dates | CSV Explorer parses a variety of date and time formats including ISO 8601 |
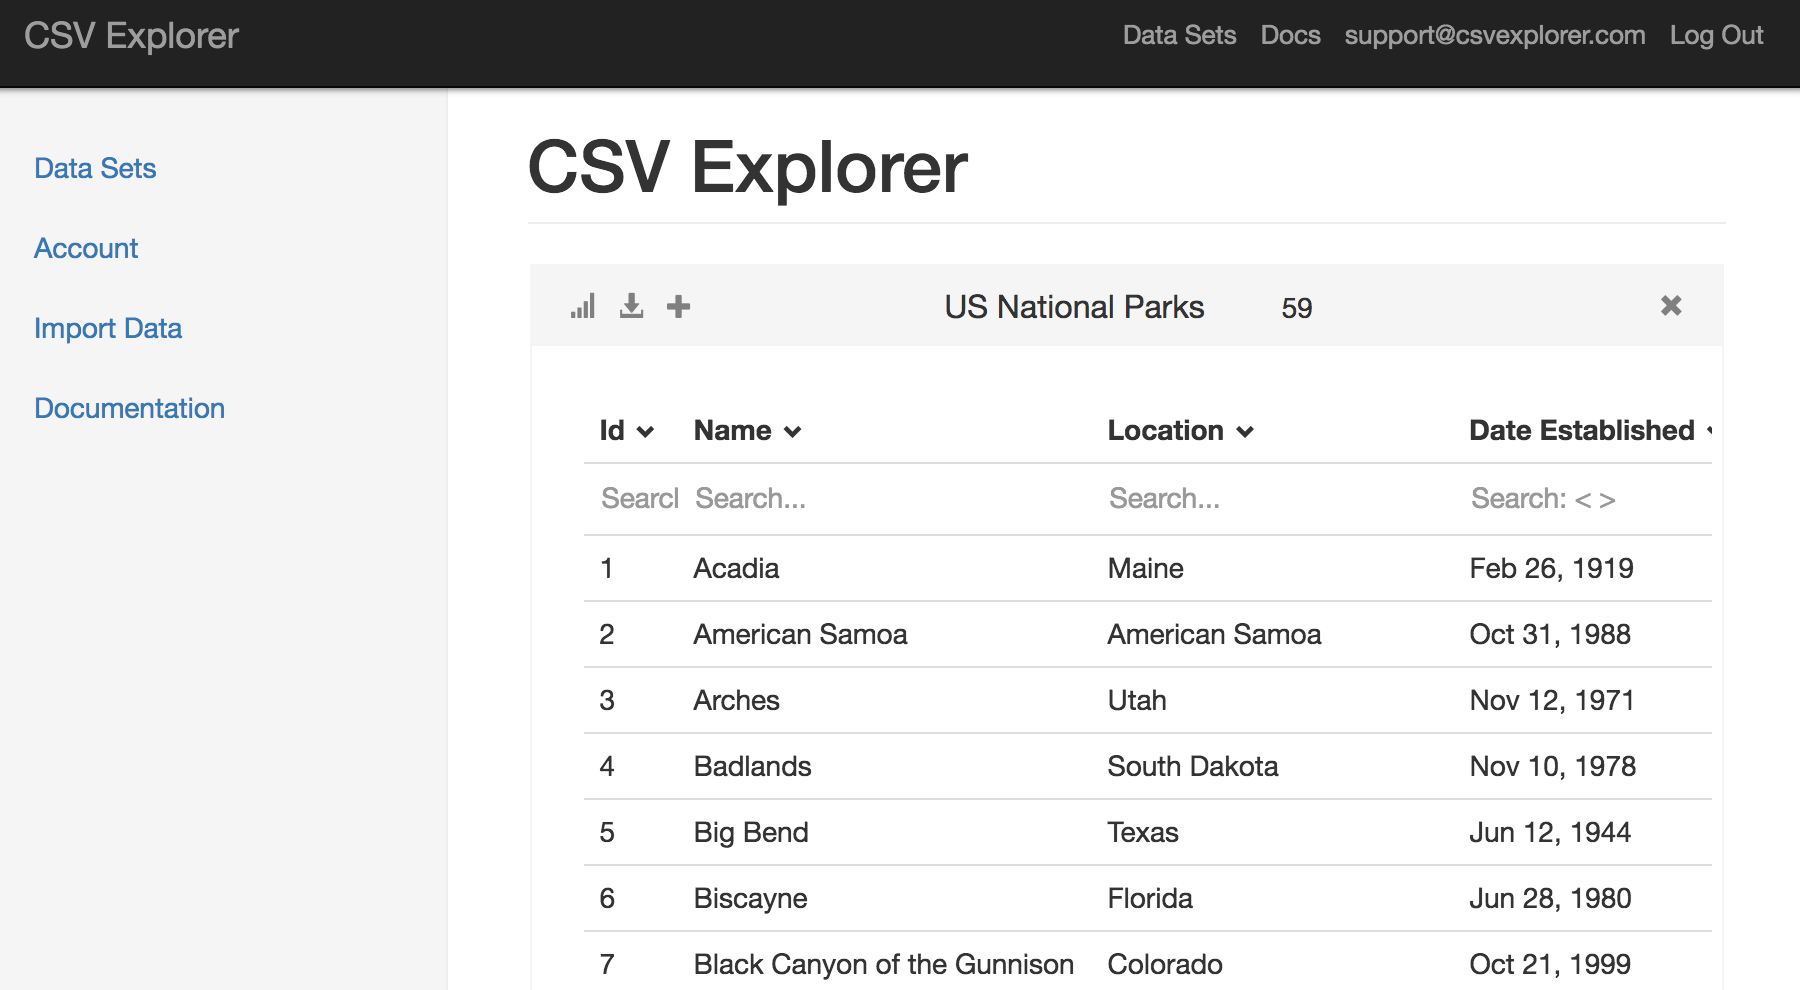
The Explorer Interface
Search
Words
Type in the search box under a column name to find rows whose value for that column contains the search string.
In this example, we look for rows whose Location contains 'dakota'.
Searching in multiple columns returns rows that match both queries.
In this example, we look for rows whose Location contains 'dakota' and whose Name contains 'bad'.
Numbers
Number fields can be filtered using the comparison operators: >, >=, <, <=.
In this example, we filter for National Parks whose Area is greater than 5 million acres.
Dates
Dates and times can be filtered using the comparison operators: >, >=, <, <=.
In this example, we filter parks established after Jan 1, 2010.
Regular Expressions
To search by regular expression, begin searches with /.
Regular expressions are a common technique for advanced string searches. Learn more about regular expressions here.
In this example, we search by regular expression to search for National Parks whose Name begins with a vowel.
Histograms & Aggregates
Histogram
To count the occurences of each element in a column, click the column name, and then Histogram. A new table will appear containing the count of each element.
The Quick Plot iconwill plot the histogram.
In this example, we histogram Location to see how many National Parks are in each Location.
Filter and Histogram
Filters and histograms can easily be combined.
In this example, we determine which Location has had the most National Parks Established in the last 20 years.
Average, Sum, Min, Max
To compute the Average, Sum, Minimum, and Maximum values of a column, click the column name and select Avg/Sum/Min/Max.
Then select a column for which they should be computed. Leave the column selection blank to compute it over all rows.
In this example, we determine the sum of the Area for each Location, and sort to find the Locations with the smallest and largest total Area of National Parks.
Date & Time Parts
Date & Time Histograms
Dates and times are made up of parts: years, months, days, hours, etc. Date/Time Histograms are used to histogram parts of a date or time.
Click on the column, then select Date/Time Parts. Select the parts of the date or time to histogram, and then select Histogram.
In this example, we compute a histogram of the Months in Date Established to see how many National Parks have been established in each month.
The Quick Plot icon graphs the histogram.
Date/Time Part Extracts
Dates and times are made up of parts: years, months, days, hours, etc. Use a Date/Time Part Extract to create a new column, with just one component of a date or time.
Click on the column, then select Date/Time Parts. Select the parts of the date or time to extract, and then select Extract. A new table will be created, with new columns of the time parts.
In this example, we find which National Parks were established in March. We extract Month from Date Established and then filter on the new column Date Established Month to 3 (for March).
Plotting
Bar & Line Charts
To create a bar or line chart, click the Plot icon at the top left of a table. Select a graph type, and use the input fields to choose columns to use for the X and Y axes. Click Go.
Plots will be direct representations of the table. Run filters, sorts, and aggregates before plotting. To sort the X axis, select the column name and click Sort, then plot the table.
In this example, we histogram Location and make a bar chart of the resulting data to see the Count of National Parks in each Location.
Quick Plot
Certain plotting analyses are common, such as plotting the results of a histogram. In these cases, the Quick Plot icon will appear at the top left of the table.
In this example, we use Quick Plot to plot the results of a histogram.
Exporting
Download
To download a table to open in Excel or to download a chart, click the download icon at the top left of a table.
In this example, we filter to Locations containing Alaska, count how many rows we've filtered to. Then we download the results to open in Excel.
Working with CSVs
CSVs
CSV stands for Comma Separated Value. CSV files are a common data exchange file format for databases, spreadsheets, web applications, open data portals, IoT devices, and more. To get CSVs from common software and services, check out our guides below.
Databases
- CSVs in PostgreSQL (Coming soon)
- CSVs in MySQL (Coming soon)
- CSVs in SQL Server (Coming soon)
- CSVs in Oracle (Coming soon)
- CSVs in MongoDB (Coming soon)
- CSVs in SQLite (Coming soon)
Spreadsheet Sofware
- CSVs in Excel (Coming soon)
- CSVs in Google Sheets (Coming soon)
- CSVs in Numbers (Coming soon)
Websites
- CSVs from Amazon (Coming soon)
- CSVs from Facebook (Coming soon)
Programming Languages
- CSVs in Python (Coming soon)
- CSVs in Javascript (Coming soon)
- CSVs in Ruby on Rails (Coming soon)